This article is the first of an ongoing serie on forecasting time series with Deep Learning and DeepDetect.
DeepDetect allows for quick and very powerful modeling of time series for a variety of applications, including forecasting and anomaly detection.
This serie of posts describes reproducible results with powerful deep network advances such as LSTMs, NBEATS and Transformer architectures.
The DeepDetect Open Source Server & DeepDetect Platform do come with the following features with application to time series:
- Multivariate time series support
- Arbitrary forecast length, for full series and signal forecasting
- Arbitrary backcast length, to make best use of the past patterns to predict the future
- Plug & play state of the art architectures
- Live visualization both during training and inference
The aim of this first post on time series is to forecast the monitoring signal from a space probe. This is a requirement for being able to detect anomalies, as a second step.
Timeseries forecasting with DeepDetect
DeepDetect supports timeseries forecasting with its Libtorch backend.
This first post builds a one step ahead forecasting model in just a few lines of code.
For reproducibility we use the time series from NASA benchmarks. It’s interesting that this data originates from Mars rover and orbiter telemetry, as it exhibits both mechanical dynamics and a variety of noises.
The main steps are as follows, and detailed in the rest of the article:
- Dataset setup: prepare a time serie dataset in CSV format
- Model setup: select the model type and main parameters
- Model training: train a model given the forecasting problem parameters
- Model testing: use the model on new or held-out data and study its properties
We created widgets to help model training and evaluation of the predictions. The widgets can be found in dd_widgets:
Requirements
DeepDetect provides Jupyter notebook Python widgets but that can be used independently. The time series widget comes with the DeepDetect platform.
DeepDetect time series visualization widget:
pip install "git+https://github.com/jolibrain/dd_widgets"
pip install "git+https://github.com/jolibrain/deepdetect.git#egg=dd_client&subdirectory=clients/python"
The widgets can be found in dd_widgets:
from dd_widgets import timeseries as ts
from dd_widgets.timeseries.lstm import LSTM
Dataset setup
The original dataset can be downloaded from https://github.com/khundman/telemanom#to-run-with-local-or-virtual-environment
The data is stored in a numpy array, and needs to be convert into a CSV file so that DeepDetect can read and preprocess it.
The application under study is a one-step prediction task, thus the CSV must contain:
- A column named
0that contains the input signal - A column named
0_f1that contains the same signal but shifted by 1 timestep.
The column 0 is used as input and and 0_f1 as the target.
The preprocessed dataset can be downloaded from https://www.deepdetect.com/dd/datasets/nasa_smap_msl_dd.tar.gz
DeepDetect setup
Run a DeepDetect Server from Docker or command line. By default it listens on 127.0.0.1:8080.
Model setup
The example below makes use of the A-4_f signal from the NASA dataset, this can be applied to all other signals as well.
datadir = "/path/to/nasa/A-4_f1"
model_name = "lstm_nasa_a4"

lstm = LSTM(
    sname = "lstm_timeseries",
    host = "127.0.0.1",
    port = 8080,

    models_dir = "/path/to/models/",
    models = [model_name],

    # all columns of the csv
    columns = ["0", "0_f1"],
    # target column
    target_cols = ["0_f1"],
    # ignored columns. All columns that are neither target
    # nor ignored are considered as input data
    ignored_cols = [],

    # Model parameters
    layers = ["L32", "L32", "L32"]
    # predict at one timestep in the future
    pred_distance = 1,

    # Training parameters
    gpuid = 0,
    batch_size = 100,
    iter_size = 1,
    iterations = 100000,

    # predictions are cached in this directory to save time
    output_dir = "/path/to/predictions/",
    # root directory of the prediction data
    datadir = datadir,
    # ts.get_datafiles retrieves all csv files from a directory
    datafiles = ts.get_datafiles(datadir),
)
This creates a recurrent deep neural network with LSTM layers. It is a common setup for time series forecasting with Deep Learning. As we’ll see in forthcoming posts, there are more powerful networks from recent advances in the domain.
At this stage though, a 3-LSTM layers network is well suited for this univariate time series forecasting. Every LSTM layer has size 32. It is expected to train on GPU with a batch size of 100 and for 100k iterations.
Data lookup
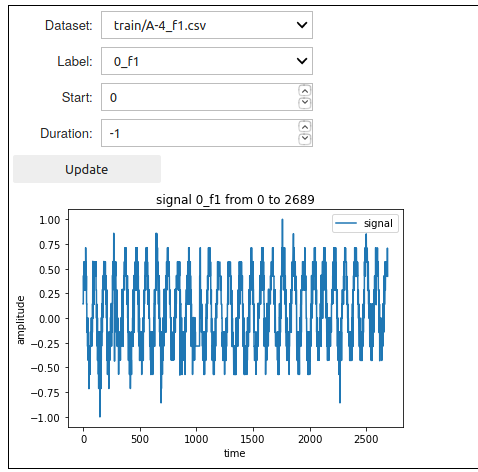
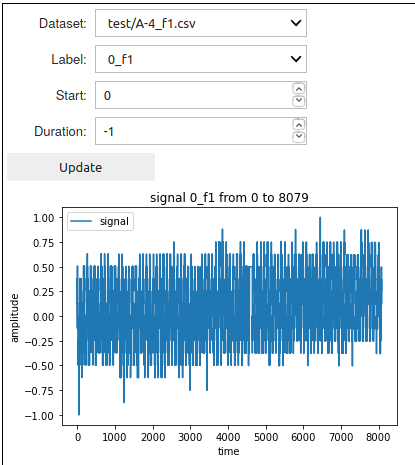
Now that the model has been setup, the DeepDetect time series widget allows the target signal to be visualized with:
lstm.dataset_ui()
Model training
DeepDetect makes the training step easy and robust. Here to train the model with train dataset located at datadir + "/train" and test dataset located at datadir + "/test":
train_data = [datadir + "/train", datadir + "/test"]
# create a service with name `lstm.sname` and model `model_name`
lstm.create_service(model_name)
# train service `lstm.sname` on data `train_data`
lstm.train(train_data)
This start training and then returns immediately, while the training job runs in the background. Expect between 30 minutes and one hour for this job, depending on your GPU.
Training metrics can be monitored with the DeepDetect Platform, or with the DeepDetect Server API.
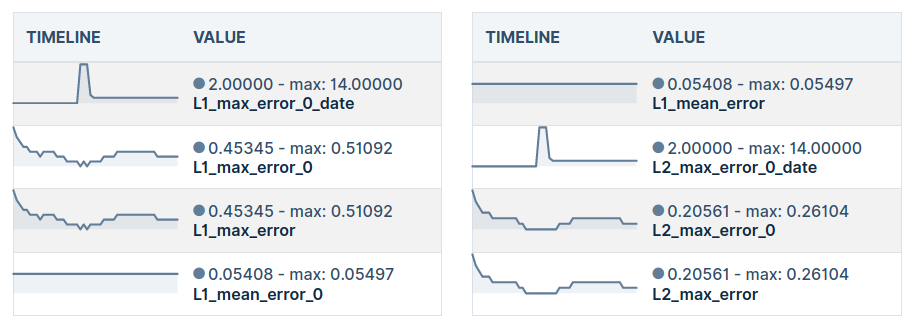
Prediction
Once training has ended, the model is ready to be used for inference on new data.
Forecast result can be visualized with the forecast UI:
# With override = False, if predictions have already been
# computed, they are reloaded from the cache.
# If you want to force prediction again, you can set override to True
lstm.predict_all(override = False)
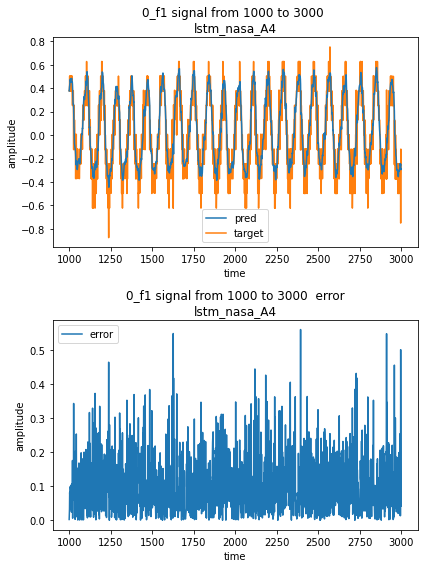
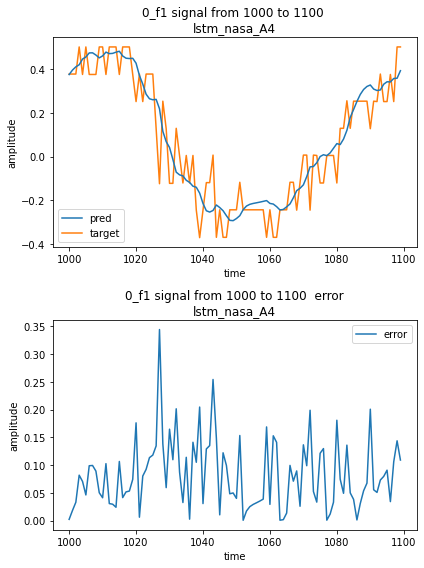
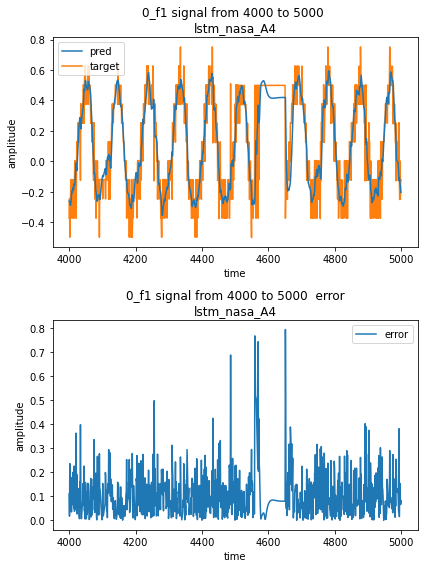
lstm.forecast_ui()
This UI displays the target signal alongside with the model prediction, and the resulting error.